Real world Pandas: Binning and Grouping
Wed 03 April 2013
I would have a hard time working without the Pandas library at this point. I spend a lot of time munging and anayzing tabular data, and pandas is a critical part of my workflow. I wanted to quickly demonstrate a couple small pieces of code from my side project climatic that show the relative power of pandas, then dive into the guts of what's happening behind the scenes.
If you are interested in tinkering with the data used in this example, see the examples folder in the climatic repo. There are a couple example scripts in there as well that outline how to use climatic to manipulate the data.
First lets use climatic to import the data via a thin wrapper around pandas read_table that has some column header parsing conveniences:
import pandas as pd
import numpy as np
import climatic as cl

walsenburg = cl.MetMast()
walsenburg.wind_import(r'CO_Walsenburg_South_Data.txt',
                       header_row=0, time_col=0,
                       delimiter='\t', smart_headers=True)
Climatic will parse the headers into tuples with an attribute and a height, for manipulating later with a pandas MultiIndex. Next, lets bin all of the data by wind frequency:
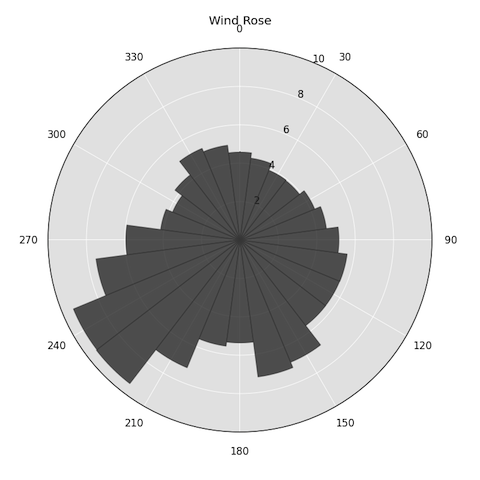
freq_bins = np.arange(0, 375, 15)
walsenburg.binned(column=('WD Mean 1', 49), bins=freq_bins, stat='mean',
                  plot=('WS Mean 1', 50))
This will give us a matplotlib plot of the WS Mean 1 signal, averaged by sector:
So, what's happening behind the scenes here? Less than 20 lines of core code make it all happen. First, lets grab a subset of our data to make following this easier, then use numpy to set up a little mapper:
import numpy as np

#Turn a few columns into a new DataFrame
data = pd.DataFrame({'Wind Speed 1': walsenburg.data[('WS Mean 1', 50.0)],
                     'Wind Speed 2': walsenburg.data[('WS Mean 2', 50.0)],
                     'Wind Dir 1': walsenburg.data[('WD Mean 1', 49.0)],
                     'Wind Dir 2': walsenburg.data[('WD Mean 2', 38.0)]},
                     index=walsenburg.data.index)

#Write a short mapper that bins data
def map_bin(x, bins):
    kwargs = {}
    if x == max(bins):
        kwargs['right'] = True
    bin = bins[np.digitize([x], bins, **kwargs)[0]]
    bin_lower = bins[np.digitize([x], bins, **kwargs)[0]-1]
    return '[{0}-{1}]'.format(bin_lower, bin)
np.digitize is doing our heavy lifting, by bracketing our x value in the bin. The kwargs are necessary in order to address the edge case where x and the max bin are the same, and thus to include it we need to set right=True in np.digitize.
Lets check our mapper:
>>>map_bin(274, freq_bins)
'[270-285]'
>>>map_bin(60, freq_bins) #np.digitize defaults to right=False
'[60-75]'
>>>map_bin(360, freq_bins) #Edge case works!
'[345-360]'
Now lets map it to our data:
>>>data[:10]
                         Wind Dir 1  Wind Dir 2  Wind Speed 1  Wind Speed 2
Date & Time Stamp
2010-06-01 14:00:00         245         261         12.05         12.26
2010-06-01 14:10:00         244         258         11.48         11.60
2010-06-01 14:20:00         245         260         14.19         14.39
2010-06-01 14:30:00         249         268         13.21         13.43
2010-06-01 14:40:00         246         263         11.92         12.12
2010-06-01 14:50:00         235         255         11.90         12.05
2010-06-01 15:00:00         232         249         12.78         12.92
2010-06-01 15:10:00         234         252         13.27         13.40
2010-06-01 15:20:00         234         252         14.05         14.24
2010-06-01 15:30:00         233         251         13.32         13.48

>>>data = data.dropna() #The mapper won't be happy with NA values
>>>data['Binned'] = data['Wind Dir 1'].apply(map_bin, bins=freq_bins)
>>>data[['Wind Dir 1','Binned']][:10]
                         Wind Dir 1     Binned
Date & Time Stamp
2010-06-01 14:00:00         245  [240-255]
2010-06-01 14:10:00         244  [240-255]
2010-06-01 14:20:00         245  [240-255]
2010-06-01 14:30:00         249  [240-255]
2010-06-01 14:40:00         246  [240-255]
2010-06-01 14:50:00         235  [225-240]
2010-06-01 15:00:00         232  [225-240]
2010-06-01 15:10:00         234  [225-240]
2010-06-01 15:20:00         234  [225-240]
2010-06-01 15:30:00         233  [225-240]
Finally, lets group the data by 'Binned' and average the data for each bin:
>>>grouped = data.groupby('Binned')
>>>grouped_data = grouped.mean()
>>>grouped_data.head()
               Wind Dir 1  Wind Dir 2  Wind Speed 1  Wind Speed 2
Binned
[0-15]       6.822575   31.094926      4.573297      4.371899
[105-120]  111.928729  132.076001      5.626556      6.024371
[120-135]  126.822383  146.176534      5.613520      5.835964
[135-150]  141.683526  162.210983      5.617823      5.780949
[15-30]     21.533770   45.891117      4.295620      4.198170

#Close, but lets rearrange that index...

>>>step = freq_bins[1]-freq_bins[0]
>>>new_index = ['[{0}-{1}]'.format(x, x+step) for x in freq_bins]
>>>new_index.pop(-1) #We dont need [360-375]...
>>>grouped_data = grouped_data.reindex(new_index)

            Wind Dir 1  Wind Dir 2  Wind Speed 1  Wind Speed 2
[0-15]       6.822575   31.094926      4.573297      4.371899
[15-30]     21.533770   45.891117      4.295620      4.198170
[30-45]     37.047317   59.679583      3.927675      3.960149
[45-60]     51.892241   74.951293      3.900810      4.004444
[60-75]     66.828717   88.899354      4.207535      4.362599
[75-90]     82.212025  102.702532      4.536062      4.788042
[90-105]    97.385444  117.748979      5.149796      5.516673
[105-120]  111.928729  132.076001      5.626556      6.024371
[120-135]  126.822383  146.176534      5.613520      5.835964
[135-150]  141.683526  162.210983      5.617823      5.780949
[150-165]  157.483837  176.898332      6.887868      6.971621
[165-180]  171.589352  188.888889      7.188426      7.194069
[180-195]  187.002382  203.015485      5.355545      5.407082
[195-210]  202.717400  219.100039      5.571109      5.657147
[210-225]  218.342431  232.987274      7.196849      7.313788
[225-240]  232.394529  247.631333      9.423809      9.594018
[240-255]  247.634660  262.238499      9.388131      9.605217
[255-270]  260.905513  277.101137      7.559757      7.802381
[270-285]  276.039922  291.899464      5.941962      6.203880
[285-300]  291.521139  306.436152      4.164875      4.377459
[300-315]  307.145844  319.766446      3.795752      3.990653
[315-330]  322.087945  332.487648      4.263681      4.391398
[330-345]  337.370640  294.193944      5.160487      5.229559
[345-360]  352.397252   34.222820      4.973387      4.941254
Voila! All of the data has been grouped by frequency, taking a mean of the data within any one bin. We could have also grouped by max:
>>>grouped_max = grouped.max().reindex(new_index)
               Wind Dir 1  Wind Dir 2  Wind Speed 1  Wind Speed 2
[0-15]             14         359         19.67         18.40
[15-30]            29         358         13.87         13.40
[30-45]            44         359         15.83         15.50
[45-60]            59         359         16.48         16.59
[60-75]            74         354         17.61         17.59
[75-90]            89         354         17.06         17.20
[90-105]          104         334         18.12         18.85
[105-120]         119         352         16.98         17.27
[120-135]         134         345         17.36         17.42
[135-150]         149         329         20.71         20.46
[150-165]         164         316         19.94         19.83
[165-180]         179         359         19.67         19.31
[180-195]         194         357         18.73         18.36
[195-210]         209         358         19.18         19.04
[210-225]         224         356         25.82         25.91
[225-240]         239         359         29.64         29.73
[240-255]         254         359         30.71         30.75
[255-270]         269         358         26.15         26.31
[270-285]         284         359         24.74         24.96
[285-300]         299         355         18.28         18.46
[300-315]         314         359         16.99         17.32
[315-330]         329         359         16.68         17.05
[330-345]         344         359         18.77         18.93
[345-360]         359         359         18.74         18.47
Ahhhh the magic of Pandas.