Vincent and iPython
Tue 23 April 2013
2013-10-07 Update: Please see the new Vincent docs for updated iPython 1.0 plotting syntax.
Thanks to the work of Abraham Flaxman(github), Vincent now supports iPython plotting, with just two additional lines of initialization required:
import vincent
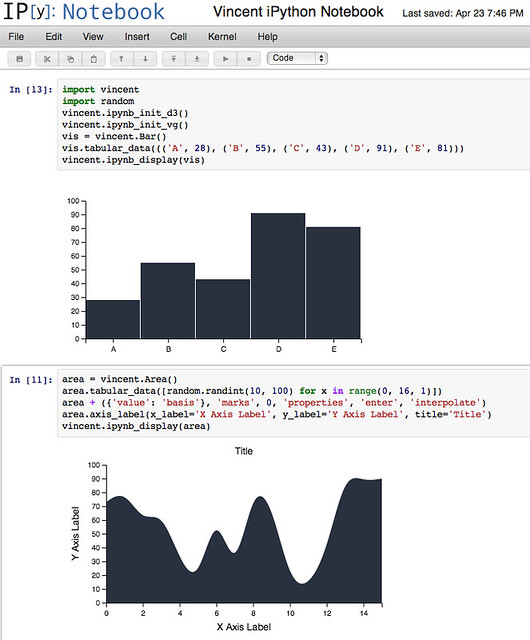
vincent.ipynb_init_d3()
vincent.ipynb_init_vg()
vis = vincent.Bar()
vis.tabular_data((('A', 28), ('B', 55), ('C', 43), ('D', 91), ('E', 81),
('F', 53), ('G', 19), ('H', 87), ('I', 52)))
vincent.ipynb_display(vis)
 .
.
Unfortunately, js embeds like this don't play nice with nbviewer- to see it in action, go grab the example and run it on a local server.
I also recommend checking out Abraham's blog, where he has some most excellent pixellated carrots.