Quandl and Pandas
Sat 27 April 2013
The folks at Quandl have built a nice little python interface for accessing their data and getting it into Pandas. My goal was to grab some data for all 50 states for a given date and get it into a DataFrame with the states as the index and different types of data as the columns. Right now the data is split up on a state-by-state basis (rather than all 50 states as a single table of data), so I wrote a small snippet to grab each state for a given date, then concat them all into a complete Pandas DataFrame:
import pandas as pd
import Quandl
import vincent

abbvs = ['AK', 'AZ', 'AR', 'CA', 'CO', 'CT', 'DE', 'FL', 'GA', 'HI', 'ID',
         'IL', 'IN', 'IA', 'KS', 'KY', 'LA', 'ME', 'MD', 'MA', 'MI', 'MN',
         'MS', 'MO', 'MT', 'NE', 'NV', 'NH', 'NJ', 'NM', 'NY', 'NC', 'ND',
         'OH', 'OK', 'OR', 'PA', 'RI', 'SC', 'SD', 'TN', 'TX', 'UT', 'VT',
         'VA', 'WA', 'WV', 'WI', 'WY']

#Set up dict with Dataset names, Quandl Codes, and empty lists for our data
data = {'Unemployment': {'Code': 'UR', 'data': []},
        'House Price Index': {'Code': 'STHPI', 'data': []}}
date = '2012-10-01'

#Will populate the list with 1-line DataFrames, then concat the pieces in the end
df_list = []
for key, value in data.iteritems():
    for state in abbvs:
        #Grab our data with the Quandl API
        quandl_code = 'FRED/{0}{1}'.format(state, value['Code'])
        df = Quandl.get(quandl_code,
                        authtoken='*******',
                        startdate=date,
                        enddate=date)

        #The data defaults to date- since I'm only grabbing one month, I would
        #rather have the data category as the (after I transpose) column name
        df = df.rename(columns={'Value': state},
                       index={pd.to_datetime(date): key})
        value['data'].append(df.T)

    #Take the data for each state, stack them into one dataframe column
    stacked = pd.concat(data[key]['data'])
    data[key]['data'] = stacked
    df_list.append(stacked)

#Turn two single-column 'Unemployment' and 'House Price Index' df's into one
all_data = pd.concat(df_list, axis=1)

>>>all_data
        House Price Index  Unemployment
    AK             289.32           6.8
    AZ             258.33           8.1
    AR             245.78           7.2
    CA             405.78          10.1
    CO             345.98           7.7
    CT             392.27           8.4
    DE             407.31           7.1
    FL             280.15           8.2
    GA             258.18           8.8
    HI             456.91           5.4
    ID             266.10           6.6
    IL             303.92           8.8
    IN             244.66           8.4
    IA             251.59           5.1
    KS             234.53           5.6
    KY                NaN           8.1
    LA             245.82           5.9
    ME             452.29           7.2
    MD             407.38           6.8
    MA                NaN           6.7
    MI                NaN           9.1
    MN                NaN           5.6
    MS             239.13           9.1
    MO                NaN           6.7
    MT                NaN           5.8
    NE                NaN           3.9
    NV             191.11          10.3
    NH             392.91           5.7
    NJ             458.39           9.6
    NM                NaN           6.8
    NY                NaN           8.4
    NC                NaN           9.4
    ND                NaN           3.2
    OH             239.16           6.9
    OK                NaN           5.2
    OR             357.07           8.5
    PA             367.16           8.0
    RI                NaN          10.1
    SC             305.20           8.8
    SD             301.00           4.4
    TN                NaN           7.8
    TX                NaN           6.4
    UT             316.56           5.5
    VT             442.03           5.0
    VA             397.53           5.8
    WA             392.27           7.8
    WV             215.77           7.5
    WI             296.69           6.8
    WY             277.86           5.1
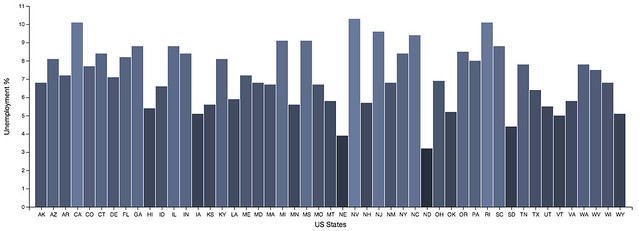
Lots of NaN in that housing data. Let's plot the unemployment data with Vincent really quickly:
vis = vincent.Bar(width=1200, height=400)
vis.tabular_data(all_data, columns=['Unemployment'])
vis.scales.append({'name': 'color',
                   'domain': {'data': 'table', 'field': 'data.y'},
                   'range': ['#0b0d11', '#6a7a9d']})
vis + ({'scale': 'color', 'field': 'data.y'}, 'marks', 0, 'properties',
       'update', 'fill')
vis.axis_label(x_label='US States', y_label='Unemployment %')
vis.to_json(path)

Sorry about the small axis labels- I think I need to find a wider blog template (or stop trying to make ordinal plots with 50 items...)