Creating Map Visualizations in <10 lines of Python
Mon 29 April 2013
13-10-07 Update: Please see the Vincent docs for updated map plotting syntax. A new post about maps (with improved examples!) can be found here.
import vincent
world_countries = r'world-countries.json'
world = vincent.Map(width=1200, height=1000)
world.geo_data(projection='winkel3', scale=200, world=world_countries)
world.to_json(path)
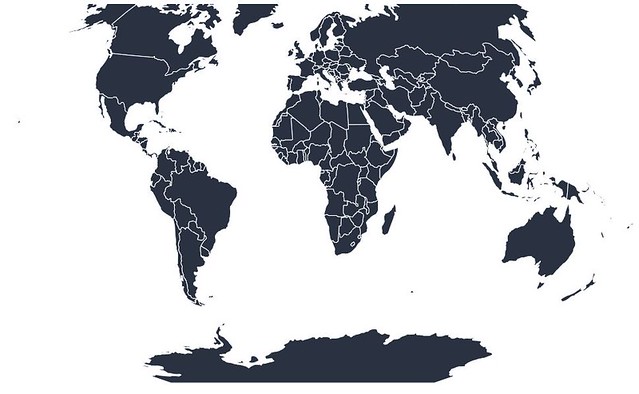
One of my goals when I started building Vincent was to streamline the creation of maps as much as possible. There are some excellent Python map libraries out there- see Basemap and Kartograph for more fun with maps. I highly recommend both of those tools, as they are both quite good and very powerful. I wanted something a little simpler, that relies on the power of Vega and allows for simple syntax- point to geoJSON files, specify a projection and scale/size, output the map.
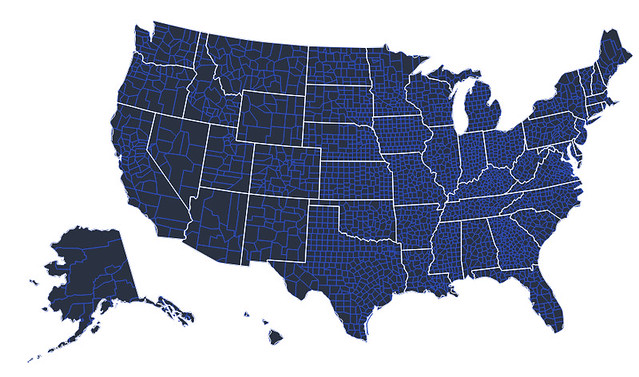
For instance, layering sets of map data in order to create more complex maps:
vis = vincent.Map(width=1000, height=800)
#Add the US county data and a new line color
vis.geo_data(projection='albersUsa', scale=1000, counties=county_geo)
vis + ('2B4ECF', 'marks', 0, 'properties', 'enter', 'stroke', 'value')

#Add the state data, remove the fill, write Vega spec output to JSON
vis.geo_data(states=state_geo)
vis - ('fill', 'marks', 1, 'properties', 'enter')
vis.to_json(path)
Additionally, choropleth maps were begging for a binding to the Pandas DataFrame, with data columns mapping directly to map features. Assuming a 1:1 mapping from geoJSON features to column data, the syntax is very straightforward:
#'merged' is the Pandas DataFrame
vis = vincent.Map(width=1000, height=800)
vis.tabular_data(merged, columns=['FIPS_Code', 'Unemployment_rate_2011'])
vis.geo_data(projection='albersUsa', scale=1000, bind_data='data.id', counties=county_geo)
vis + (["#f5f5f5","#000045"], 'scales', 0, 'range')
vis.to_json(path)
This isn't without a little data wrangling and transformation- the user needs to ensure that there is a 1:1 mapping of keys in the geoJSON to row keys in the Pandas DataFrame. Here is what was required to get a clean DataFrame for mapping for the previous example: our county data is a csv with FIPS code, county name, and our economic data (column names withheld):
00000,US,United States,154505871,140674478,13831393,9,50502,100
01000,AL,Alabama,2190519,1993977,196542,9,41427,100
01001,AL,Autauga County,25930,23854,2076,8,48863,117.9
01003,AL,Baldwin County,85407,78491,6916,8.1,50144,121
01005,AL,Barbour County,9761,8651,1110,11.4,30117,72.7
And our county polygons in a geoJSON with FIPS codes as the id's (thanks to the folks at Trifacta for this data). The actual polygons have been truncated here for brevity, see the example data for the complete dataset:
{"type":"FeatureCollection","features":[
{"type":"Feature","id":"1001","properties":{"name":"Autauga"}
{"type":"Feature","id":"1003","properties":{"name":"Baldwin"}
{"type":"Feature","id":"1005","properties":{"name":"Barbour"}
{"type":"Feature","id":"1007","properties":{"name":"Bibb"}
{"type":"Feature","id":"1009","properties":{"name":"Blount"}
{"type":"Feature","id":"1011","properties":{"name":"Bullock"}
{"type":"Feature","id":"1013","properties":{"name":"Butler"}
{"type":"Feature","id":"1015","properties":{"name":"Calhoun"}
{"type":"Feature","id":"1017","properties":{"name":"Chambers"}
{"type":"Feature","id":"1019","properties":{"name":"Cherokee"}
We need to match the FIPS codes and ensure that the matches are exact, or Vega won't zip the data properly:
import json
import pandas as pd
#Map the county codes we have in our geometry to those in the
#county_data file, which contains additional rows we don't need
with open(county_geo, 'r') as f:
    get_id = json.load(f)

#Grab the FIPS codes and load them into a dataframe
county_codes = [x['id'] for x in get_id['features']]
county_df = pd.DataFrame({'FIPS_Code': county_codes}, dtype=str)

#Read into Dataframe, cast to string for consistency
df = pd.read_csv(county_data, na_values=[' '])
df['FIPS_Code'] = df['FIPS_Code'].astype(str)

#Perform an inner join, pad NA's with data from nearest county
merged = pd.merge(df, county_df, on='FIPS_Code', how='inner')
merged = merged.fillna(method='pad')

>>>merged.head()
      FIPS_Code State       Area_name  Civilian_labor_force_2011  Employed_2011  \
    0      1001    AL  Autauga County                      25930          23854
    1      1003    AL  Baldwin County                      85407          78491
    2      1005    AL  Barbour County                       9761           8651
    3      1007    AL     Bibb County                       9216           8303
    4      1009    AL   Blount County                      26347          24156

   Unemployed_2011  Unemployment_rate_2011  Median_Household_Income_2011  \
0             2076                     8.0                         48863
1             6916                     8.1                         50144
2             1110                    11.4                         30117
3              913                     9.9                         37347
4             2191                     8.3                         41940

   Med_HH_Income_Percent_of_StateTotal_2011
0                                     117.9
1                                     121.0
2                                      72.7
3                                      90.2
4                                     101.2
And now we can quickly generate different choropleths:
vis.tabular_data(merged, columns=['FIPS_Code', 'Civilian_labor_force_2011'])
vis.to_json(path)
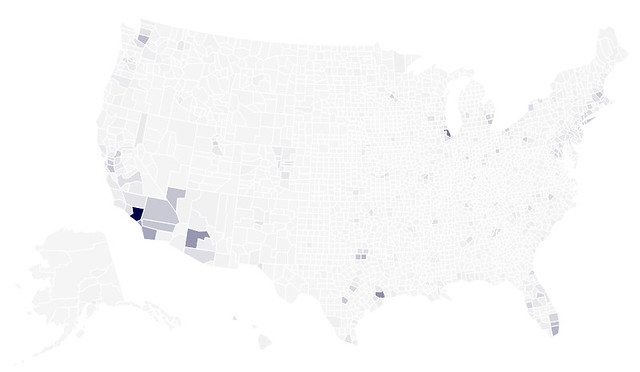
That's not telling us much other than that LA and King counties are both very large and very populous. Let's look at median household income:
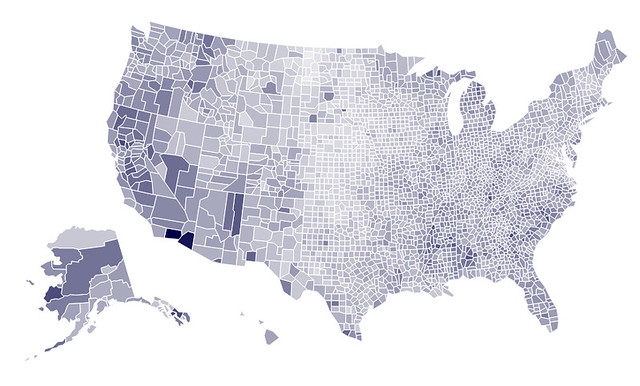
vis.tabular_data(merged, columns=['FIPS_Code', 'Median_Household_Income_2011'])
vis.to_json(path)
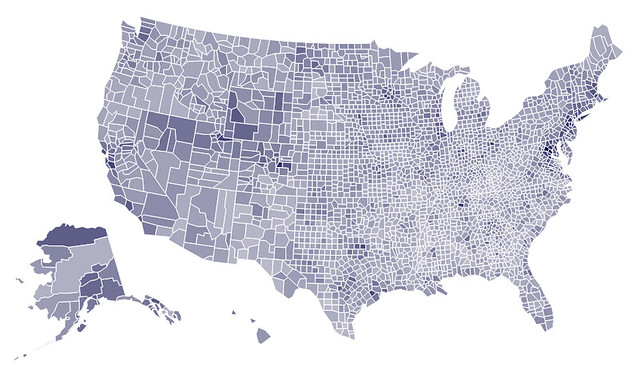
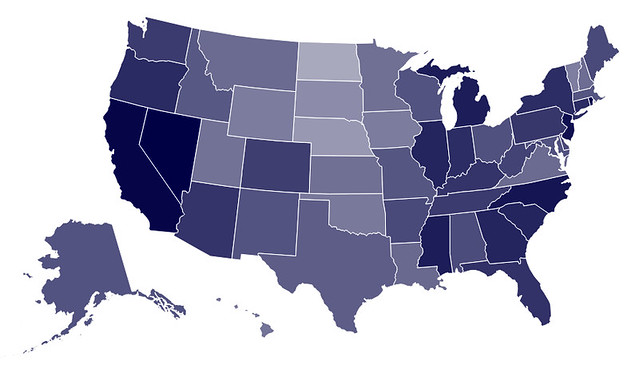
Certainly some high income areas on the east coast and in other high density areas. I bet this would be more interesting on the city level, but that will have to wait for a future post. Lets quickly reset the map and look at state unemployment:
#Swap county data for state data, reset map
state_data = pd.read_csv(state_unemployment)
vis.tabular_data(state_data, columns=['State', 'Unemployment'])
vis.geo_data(bind_data='data.id', reset=True, states=state_geo)
vis.update_map(scale=1000, projection='albersUsa')
vis + (['#c9cedb', '#0b0d11'], 'scales', 0, 'range')
vis.to_json(path)
Maps are a passion of mine- this is one area where I really want to make Vincent very strong, including the ability to easily add points, markers, etc. If you the reader have any features you would like to see with regarding to mapping, please post an issue on Github